Why Pie Charts Can Mislead Your Data Interpretation
by
Natraj Kanamarlapudi
Table of Contents
Introduction
When it comes to visualizing data, there is a multitude of chart types to choose from, each one with its own strengths and weaknesses. One such widely used tool is the pie chart. It is no secret that pie charts are popular among both data scientists and casual data users alike. However, there are compelling reasons to believe that pie charts may not be as effective as they seem. Today, we delve into the often-misunderstood aspects of pie charts and their potential to mislead your data interpretation.
Understanding Pie Charts and Their Popularity
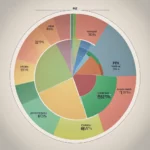
Pie charts serve as a common tool in data visualization due to their simple and visual presentation. They represent the proportion of different categories in a whole, allowing for an easy-to-understand breakdown of data. The simplicity of a pie chart is part of its appeal. Each slice represents a unique category, and the size of each slice corresponds to the relative magnitude of that category. The whole picture provides a straightforward way to understand the different components of the dataset. This basic visual interpretation, combined with the aesthetic appeal of a pie-shaped diagram, has contributed to the wide acceptance and use of pie charts in data representation.
Why Pie Charts can be Deceiving
Pie charts, while visually appealing, can misguide our interpretation of data. This stems from our inherent difficulty in accurately comparing the areas or angles of different slices. Unlike bar or line charts, which rely on our brain’s aptitude for comparing lengths, pie charts can often lead us to erroneous conclusions. This is because we may inadvertently misjudge the relative sizes of the pie slices. Therefore, while pie charts may initially appear to provide a straightforward illustration of data, their potential to distort perception is a significant drawback. Their widespread use, despite this inherent flaw, underscores the importance of understanding the nature and limitations of each chart type when visualizing data.
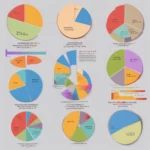
A Closer Look at the Drawbacks of Pie Charts
The pitfalls of pie charts primarily center around human perception. When slices are similar in size, determining which is larger becomes difficult, causing errors in interpretation. Furthermore, pie charts fail to effectively represent zero or negative values and struggle with handling too many categories. For instance, when the dataset is large, a pie chart may appear cluttered and overwhelming. Another critical drawback is the lack of a common baseline for comparison, unlike bar or line charts. Lastly, the placement of slices also impacts our understanding. We tend to perceive slices placed at the top of the pie as larger than they actually are. Overall, these perception-based drawbacks make pie charts less reliable for effective data interpretation.
Alternatives to Pie Charts for Effective Data Visualization
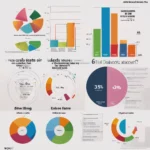
If pie charts present potential drawbacks, what other chart types can serve as effective alternatives? The answer lies in a broad spectrum of data visualization tools such as bar charts, line graphs, and scatter plots. Bar charts utilize length, a dimension our brains comprehend with precision, to exhibit data, offering a straightforward comparison between different categories. Line graphs excel in representing trends across a timeframe, while scatter plots can effectively highlight correlations between various data points. With these alternative chart types, it becomes possible to circumvent the issues commonly associated with pie charts, paving the way for clearer and more accurate data interpretation.
Case for Bar Charts over Pie Charts
Bar charts often prove to be a more effective choice over pie charts in various situations. They excel in displaying the same information, but with enhanced clarity and precision. A bar chart’s capability to handle a large number of categories effortlessly is a significant advantage, unlike the cluttered presentation of pie charts with similar data. They present a common scale which simplifies the task of comparing various data categories. Another prominent strength of bar charts is their ability to seamlessly incorporate zero and negative values. With these characteristics, bar charts tend to reduce misinterpretations and enhance the clarity of data representation.
Importance of Choosing the Right Chart Types
Selecting the most suitable chart types is critical in data visualization. Although pie charts are widely used, they can often result in data misinterpretation. Recognizing the potential drawbacks of any chart type is crucial, as is making informed decisions based on the nature of your data and the information you want to communicate. The objective isn’t just about creating a visually appealing chart, but to accurately and clearly present your data. The right chart can transform intricate data into a captivating narrative, making a difference between misinterpretation and comprehensive understanding. It’s not about complexity, but clarity and precision that matter in data visualization.
Please note that the views expressed above are solely my personal opinions and do not reflect the viewpoints of my present or past employers.
Want to keep up with our blog?
Receive valuable tips directly in your inbox whenever a new blog post is released.